News Release
Financial results
Announcement of the Settlement of Accounts for the Third Quarter of the Year Ending March 2017
2017.2.8
(Note) Figures shown have been rounded down to the nearest million yen
Our settlement of accounts for the third quarter of the year ending March 2017 was announced on the afternoon of Wednesday, February 8 at the Tokyo Stock Exchange Press Club. An outline of the accounts is presented below.
Consolidated Results for the Third Quarter of the Year Ending March 2017 (April 1, 2016 to December 31, 2016)
Consolidated operating results (total)
(% is in comparison to the previous year)
| Revenue | Operating profit | Ordinary profit | Net income attributable to shareholders of parent company for quarter | |||||
|---|---|---|---|---|---|---|---|---|
| (millions of yen) | (%) | (millions of yen) | (%) | (millions of yen) | (%) | (millions of yen) | (%) | |
| Third quarter of the year ending March 2017 | 218,372 | 1.8 | 15,649 | 24.5 | 15,740 | 52.2 | 11,468 | 79.5 |
| Third quarter of the year ending March 2016 | 214,413 | 6.4 | 12,565 | 16.2 | 10,340 | (3.3) | 6,387 | (14.1) |
- *Comprehensive income:
-
- 3Q for year ending March 2017: 4,837 million yen (-%)
- 3Q for year ending March 2016: 278 million yen (-102.3%)
Overview of the third quarter of the year ending March 2017
The Japanese economy during the company’s first half of the fiscal year saw robust progress in employment and income, and personal consumption is gradually recovering, the economy saw a gentle recovery. Against a backdrop of high expectations for the next government, the USA's economy is growing gently. While the Europe faces the impact of the UK's decision to leave the European Union (EU) and the risk of a slowing economy due to financial instability, gradual recovery in personal consumption and exports means the economy is gradually recovering. Sluggish growth in China and developing countries and other such factors led to a continuation of uncertainty in the global economy.
Against this backdrop and in line with the fundamental policies of “sustainable management”, “global management”, and “technological management” in our rolling midterm management plan called “Renaissance Fuji 2018” (April 2016 - March 2019), we have been enhancing operational strength through our growth strategy, profit structure reform, and the construction of a supply chain, and engaging in product development meeting the needs of customers while delivering high-functionality ingredients.
As a result, for the third quarter of the year ending March 2017, we achieved consolidated revenue of 218,372 million yen (increase of 1.8% y-o-y), operating profit of 15,649 million yen (increase of 24.5% y-o-y), ordinary profit of 15,740 million yen (increase of 52.2% y-o-y) and net income attributable to shareholders of parent company of 11,468 million yen (increase of 79.5% y-o-y).
Overviews by division are as follows:
Oils and Fats Processing division
| FY2015 Q3 Total | FY2016 Q3 Total | Comparison to the previous year | ||
|---|---|---|---|---|
| Difference (amount) | Difference (ratio) | |||
| Revenue | 816 | 812 | (4) | (0.5%) |
| Operating profit | 47 | 55 | +9 | +19.0% |
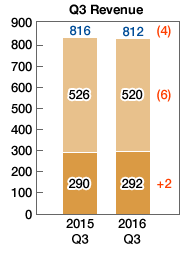
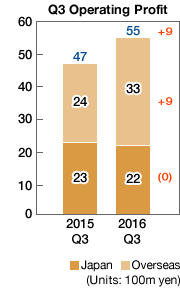
Sales of frying oil, palm oil for confectionery oils and fats, and hard butters for chocolate for the Japanese market increased. Overseas, while sales of palm oil grew particularly in the US, yen translation by overseas group companies resulted in losses due to a strong yen, which in turn resulted in decreased sales. Profits increased due to increased sales and profitability.
Through these results, this division achieved a sales volume of 81,170 million yen (decrease of 0.5% y-o-y) and an operating profit of 5,548 million yen (increase of 19.0% y-o-y).
Confectionery and Bakery Ingredients division
| FY2015 Q3 Total | FY2016 Q3 Total | Comparison to the previous year | ||
|---|---|---|---|---|
| Difference (amount) | Difference (ratio) | |||
| Revenue | 1,020 | 1,082 | +63 | +6.1% |
| Operating profit | 68 | 80 | +12 | +17.0% |
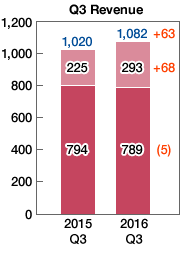
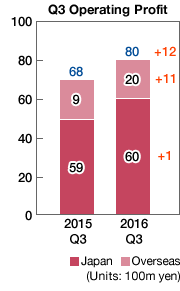
Revenue and profit increased due to factors including growth in sales of industrial use chocolate and chocolate for frozen confectionery and creams for the Japanese market, smooth sales of filling products in the Chinese market, blunt growth of sales at the Brazilian chocolate manufacturing and sales company Harald which became a consolidated subsidiary company in the previous fiscal year (revenue for Harald in the previous fiscal year is in the process of consolidation from the start of the third quarter of the consolidated accounting period), and inclusion of the cost of acquiring stock in Harald.
Through these results, this division achieved a sales volume of 108,234 million yen (increase of 6.1% y-o-y) and an operating income of 7,975 million yen (increase of 17.0% y-o-y).
Soy division
| FY2015 Q3 Total | FY2016 Q3 Total | Comparison to the previous year | ||
|---|---|---|---|---|
| Difference (amount) | Difference (ratio) | |||
| Revenue | 309 | 290 | (19) | (6.1%) |
| Operating profit | 11 | 21 | +10 | +95.9% |
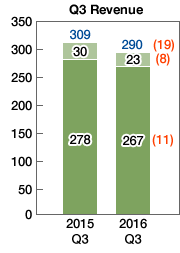
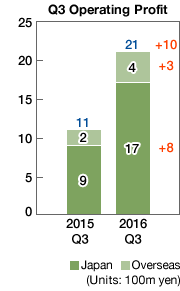
For Soy Protein ingredients, while sales decreased for the meat and processed foods markets, sales in the health foods market were robust and improvements were made to profitability, which lead to increased profits. Sales of soy protein food products for instant deep-fried products and food function-enhancing ingredients for beverages also increased. However, with regards to overall sales in this department, sales decreased for soy milk due to the consolidated subsidiary Toraku Foods transferred the retail business of soy milk, which led to a decrease in revenue. Profit increased through profitability improvements delivered by business reconstruction and cost reductions.
Through these results, this division achieved a sales volume of 28,968 million yen (decrease of 6.1% y-o-y) and an operating profit of 2,124 million yen (increase of 95.9% y-o-y).
Forecasts for Consolidated Results for the Year Ending March 2017 (Friday, April 1, 2016 to Friday, March 31, 2017)
(% is in comparison to the previous year)
| Revenue | Operating profit | Ordinary profit | Net income attributable to shareholders of parent company | Net income per share | |||||
|---|---|---|---|---|---|---|---|---|---|
| (millions of yen) | (%) | (millions of yen) | (%) | (millions of yen) | (%) | (millions of yen) | (%) | (yen) | |
| Full Year | 292,000 | 1.6 | 19,600 | 16.4 | 18,200 | 28.9 | 12,000 | 30.1 | 139.60 |
(Note) No revisions for forecast consolidated figures were made this quarter
*Qualitative information regarding forecast consolidated figures
No revisions have been made for the full-year forecast announced on November 8, 2016. Revisions will promptly be announced if deemed necessary after determining the changes that may arise in the Company’s business environment.
*Explanation and other notes regarding appropriate utilization of the predictions The forecasts above have been made based on assumptions deemed rational together with information available at the time of this announcement, and the actual results may differ from these forecasts due to various factors.
More Detail
Overview of Consolidated Profits and Losses
(Units: 100m yen)
| FY2015 Q3 Total | FY2016 Q3 Total | Comparison to the previous year | |||
|---|---|---|---|---|---|
| Difference (amount) | Difference (ratio) | ||||
| Revenue | Oils and Fats | 816 | 812 | (4) | (0.5%) |
| Confectionery and Bakery Ingredients | 1,020 | 1,082 | +63 | +6.1% | |
| Soy Protein | 309 | 290 | (19) | (6.1%) | |
| Total | 2,144 | 2,184 | +40 | +1.8% | |
| Operating profit | Oils and Fats | 47 | 55 | +9 | +19.0% |
| Confectionery and Bakery Ingredients | 68 | 80 | +12 | +17.0% | |
| Soy Protein | 11 | 21 | +10 | +95.9% | |
| Total | 126 | 156 | +31 | +24.5% | |
| Operating profit ratio | 5.9% | 7.2% | +1.3p | - | |
| Ordinary profit | 103 | 157 | +54 | +52.2% | |
| Net income attributable to shareholders of parent company for quarter | 64 | 115 | +51 | +79.5% | |
| Comprehensive income for quarter | (3) | 48 | +51 | - | |
Consolidated Profits and Losses by Area
| FY2015 Q3 Total | FY2016 Q3 Total | Comparison to the previous year | |||
|---|---|---|---|---|---|
| Difference (amount) | Difference (ratio) | ||||
| Revenue | Japan | 1,363 | 1,348 | (15) | (1.1%) |
| Asia | 391 | 359 | (32) | (8.2%) | |
| Europe and Americas | 391 | 477 | +87 | +22.2% | |
| Total | 2,144 | 2,184 | +40 | +1.8% | |
| Operating profit | Japan | 91 | 99 | +8 | +8.8% |
| Asia | 30 | 35 | +6 | +18.7% | |
| Europe and Americas | 8 | 22 | +15 | +190.9% | |
| Elimination | (3) | (1) | +2 | - | |
| Total | 126 | 156 | +31 | +24.5% | |
[Summary of Results]
Japan:
Decreased sales due to factors such as decreased sales of soy milk to retailers, increased profits due to reductions in raw material costs, etc.
Asia:
Decreased sales due to factors including a strong yen, and increased profit due to factors including increased profitability.
Europe/Americas:
Increased income and profit due to factors including increased net sales at Harald and increased sales of palm oil in the Americas.
Consolidated Operating Profit Transition by Quarter
(Units: 100m yen)
| Q1 (three months) | Year-on- year comparison | Q2 (three months) | Year-on- year comparison | Q3 (three months) | Year-on- year comparison | Q3 Total | Year-on- year comparison | |
|---|---|---|---|---|---|---|---|---|
| Oils and Fats | 16 | +7 | 19 | +5 | 21 | (3) | 55 | +9 |
| Confectionery and Bakery Ingredients | 25 | +12 | 18 | (3) | 36 | +3 | 80 | +12 |
| Soy Protein | 7 | +5 | 6 | +2 | 8 | +3 | 21 | +10 |
| Total | 49 | +23 | 43 | +4 | 65 | +3 | 156 | +31 |
| Q1 (three months) | Year-on- year comparison | Q2 (three months) | Year-on- year comparison | Q3 (three months) | Year-on- year comparison | Q3 Total | Year-on- year comparison | |
|---|---|---|---|---|---|---|---|---|
| Japan | 28 | +10 | 27 | +2 | 44 | (4) | 99 | +8 |
| Asia | 12 | +2 | 12 | +2 | 11 | +2 | 35 | +6 |
| Europe and Americas | 9 | +9 | 4 | (0) | 10 | +6 | 22 | +15 |
| Elimination | (0) | +3 | +0 | +1 | (1) | (2) | (1) | +2 |
| Total | 49 | +23 | 43 | +4 | 65 | +3 | 156 | +31 |
Consolidated Balance Sheet
(Units: 100m yen)
| FY2015 end of year | FY2016 end of Q3 | Comparison to the previous end of year | Main factors for increase/ decrease | |
|---|---|---|---|---|
| Current assets | 1,309 | 1,318 | +9 | Decrease in cash and deposits, increase in accounts receivable, decrease in inventory, etc. |
| Fixed assets | 1,360 | 1,349 | (11) | Increased assets related to retirement benefits, decreased accrued amortization, etc. |
| Total assets | 2,669 | 2,667 | (1) | |
| Interest-bearing liabilities | 600 | 681 | +81 | |
| Other liabilities | 581 | 525 | (56) | Decrease in unpaid corporation tax etc., decrease in long-term deferred tax assets, etc. |
| Total liabilities | 1,181 | 1,206 | +25 | |
| Total shareholder's equity | 1,488 | 1,461 | (26) | Increase in retained earnings, decrease in foreign currency translation adjustment, capital surplus, etc. |
Consolidated Cash Flow
(Units: 100m yen)
| FY2015 Q3 Total | FY2016 Q3 Total | Comparison to the previous year | |
|---|---|---|---|
| Quarter net income before tax | 104 | 165 | +61 |
| Depreciation expenses | 72 | 77 | +5 |
| Others | (112) | (134) | (23) |
| Operating cash flow | 64 | 107 | +43 |
| Investment cash flow | (298) | (97) | +202 |
| Free cash flow | (235) | 10 | +245 |
| Procurement/repayments through loans, etc. | 405 | 80 | (325) |
| Dividend payments/share buyback, etc. | (34) | (93) | (59) |
| Financial cash flow | 371 | (14) | (384) |
| Increase and decrease in cash and cash equivalents | Including translation differences 110 | Including translation differences (22) | (132) |
| Increase and decrease due to new consolidation and consolidation exclusion | 0 | (5) | (5) |
| Cash and cash equivalents at the end of period | 237 | 140 | (98) |
(Note):
▪ Depreciation expenses include depreciation of tangible fixed assets and intangible fixed assets, etc.
▪ Increase and decrease in cash and cash equivalents include translation differences on cash and cash equivalents.