News Release
Financial results
Announcement of the Settlement of Accounts for the Year Ending March 2016
2016.5.11
(Note) Figures shown have been rounded down to the nearest million yen
Our settlement of accounts for the year ending March 2016 was announced on the afternoon of Wednesday, May 11 at the Tokyo Stock Exchange Press Club. An outline of the accounts is presented below.
Consolidated Results for the Year Ending March 2016 (April 1, 2015 to March 31, 2016)
Consolidated operating results (total)
(% is in comparison to the previous year)
| Revenue | Operating profit | Ordinary profit | Net income attributable to shareholders of parent company | |||||
|---|---|---|---|---|---|---|---|---|
| (millions of yen) | (%) | (millions of yen) | (%) | (millions of yen) | (%) | (millions of yen) | (%) | |
| Year ending March 2016 | 287,537 | 5.7 | 16,840 | 18.5 | 14,121 | 5.3 | 9,227 | (1.1) |
| Year ending March 2015 | 271,903 | 7.5 | 14,211 | (6.8) | 13,405 | (9.4) | 9,330 | 14.3 |
- *Comprehensive income:
-
- Year ending March 2016: -185 million yen (-101.0%)
- Year ending March 2015: 19,325 million yen (14.4%)
Overview of the FY ending March 2016
The Japanese economy in this consolidated accounting year saw a continued modest recovery due to the fiscal and economic policies of the government and the bank of Japan, but with factors such as weakened stock prices at the start of this year and a slump in market conditions, the economic situation made no progress. With regards to the overseas economy, while the economy of United States made steady progress, economic growth was blunt in China and developing countries, and fears of a slow down in the global economy grew and lead to the continuation of a state of uncertainty.
The group continues to face a harsh business environment due to factors including sustained high prices of raw materials and weakened currencies in developing countries.
Against this backdrop, our rolling midterm management plan called “Renaissance Fuji 2017” (April 2015 - March 2018) sets forth “promotion / acceleration of global management”, “promotion / acceleration of technological management” and “promotion / acceleration of sustainable management” as our fundamental policies and we have been enhancing operational strength through growth strategy, profit structure reform, and the construction of a supply chain, and engaging in product development meeting the needs of customers, delivering high-functionality ingredients.
As a result, for the annual term ending March 2016, we achieved consolidated revenue of 287,537 million yen (5.7% y-o-y increase), operating profit of 16,840 million yen (18.5% y-o-y increase), ordinary profit of 14,121 million yen (5.3% y-o-y increase) and net income attributable to owners of parent of 9,227 million yen (1.1% y-o-y decrease).
Overviews by division are as follows:
Oils and Fats Processing Division
| Year ending March 2015 | Year ending March 2016 | Comparison to the previous year | ||
|---|---|---|---|---|
| Difference (amount) | Difference (ratio) | |||
| Revenue | 1,048 | 1,088 | +39 | +3.8% |
| Operating profit | 53 | 64 | +11 | +20.1% |
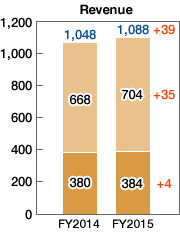
Domestically, increased sales amount from frying oil, coconut oil for confectionery oils and fats, palm oil, and hard butters for chocolate lead to an increase in income and profit.
Overseas, revenue increased due to factors including extended sales mainly in the Americas and favorable yen conversion rates due to the weakened yen. In terms of overseas profits, Asia led the way in profit growth and overseas profits saw an overall increase.
Through these results, this division achieved a sales volume of 108,771 million yen (3.8% y-o-y increase) and an operating profit of 6,397 million yen (20.1% y-o-y increase).
Confectionery and Bakery Ingredients Division
| Year ending March 2015 | Year ending March 2016 | Comparison to the previous year | ||
|---|---|---|---|---|
| Difference (amount) | Difference (ratio) | |||
| Revenue | 1,276 | 1,382 | +106 | +8.3% |
| Operating profit | 87 | 92 | +5 | +5.8% |
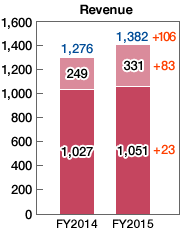
Domestically, revenue increased for chocolate due to growth in sales of sweet chocolate and other such products, while sales of creams and prepared products etc. decreased. Revenue of margarines and fillings increased, leading to increased revenue for Japan overall. In terms of profits, increased profits in Japan were seen due to increased sales and sales price revisions, despite increasing raw material prices.
Overseas, sales of chocolate, cream, margarine, and fillings progressed robustly, resulting in a revenue increase. In terms of profits overseas, a decrease was seen due to an increase in costs resulting from the accrual of costs related to the stock acquisition of the Brazilian consolidated subsidiary Harald.
Through these results, this division achieved a sales volume of 138,232 million yen (8.3% y-o-y increase) and an operating profit of 9,179 million yen (5.8% y-o-y increase).
Soy Protein Division
| Year ending March 2015 | Year ending March 2016 | Comparison to the previous year | ||
|---|---|---|---|---|
| Difference (amount) | Difference (ratio) | |||
| Revenue | 394 | 405 | +11 | +2.8% |
| Operating profit | 2 | 13 | +11 | +500.0% |
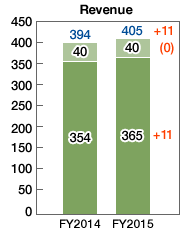
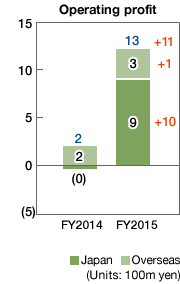
Soy protein ingredients saw declines in sales for the meat and fisheries market, but sales progressed for the health food market etc. Food function-enhancing ingredients grew steadily in products for beverages. Sales of soy protein products and soy milk and other such products were robust, and revenue increased for the division overall. Profits increased due to factors including increased profits from sales growth and cost reductions.
Through these results, this division achieved a sales volume of 40,532 million yen (2.8% y-o-y increase) and an operating profit of 1,264 million yen (500.0% y-o-y increase).
Predictions for Consolidated Results for the Year Ending March 2017 (April 1, 2016 to March 31, 2017)
(% is in comparison to the previous year)
| Revenue | Operating profit | Ordinary profit | Net income attributable to shareholders of parent company | Net income per share | |||||
|---|---|---|---|---|---|---|---|---|---|
| (millions of yen) | (%) | (millions of yen) | (%) | (millions of yen) | (%) | (millions of yen) | (%) | (yen) | |
| First 2 Quarters (Aggregate) | 147,000 | 9.6 | 6,700 | 4.1 | 6,000 | 1.2 | 3,700 | 2.2 | 43.04 |
| Full Year | 310,000 | 7.8 | 17,500 | 3.9 | 16,000 | 13.3 | 10,000 | 8.4 | 116.33 |
* Explanation and other notes regarding appropriate utilization of the predictions
The forecasts above have been made based on assumptions deemed rational together with information available at the time of this announcement, and the actual results may differ from these forecasts due to various factors.
End of report
More Detail
Overview of Consolidated Profits and Losses
(Units: 100m yen)
| Year ending March 2015 | Year ending March 2016 | Comparison to the previous year | |||
|---|---|---|---|---|---|
| Difference (amount) | Difference (ratio) | ||||
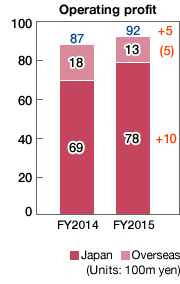
| Revenue | Oils and Fats | 1,048 | 1,088 | +39 | +3.8% |
| Confectionery and Bakery Ingredients | 1,276 | 1,382 | +106 | +8.3% | |
| Soy Protein | 394 | 405 | +11 | +2.8% | |
| Total | 2,719 | 2,875 | +156 | +5.7% | |
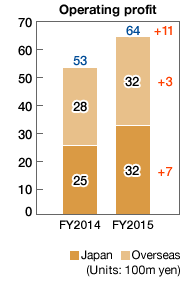
| Operating profit | Oils and Fats | 53 | 64 | +11 | +20.1% |
| Confectionery and Bakery Ingredients | 87 | 92 | +5 | +5.8% | |
| Soy Protein | 2 | 13 | +11 | +500.0% | |
| Total | 142 | 168 | +26 | +18.5% | |
| Operating profit ratio | 5.2% | 5.9% | +0.7p | - | |
| Ordinary profit | 134 | 141 | +7 | +5.3% | |
| Net income attributable to shareholders of parent company | 93 | 92 | (1) | (1.1%) | |
| Comprehensive income | 193 | (3) | (196) | - | |
Consolidated Profits and Losses by Area
(Units: 100m yen)
| Year ending March 2015 | Year ending March 2016 | Comparison to the previous year | |||
|---|---|---|---|---|---|
| Difference (amount) | Difference (ratio) | ||||
| Revenue | Japan | 1,761 | 1,800 | +38 | +2.2% |
| Asia | 547 | 530 | (17) | (3.1%) | |
| Europe and Americas | 411 | 546 | +135 | +32.7% | |
| Total | 2,719 | 2,875 | +156 | +5.7% | |
| Operating profit | Japan | 94 | 120 | +26 | +28.2% |
| Asia | 24 | 42 | +18 | +73.4% | |
| Europe and Americas | 22 | 9 | (13) | (58.9%) | |
| Elimination | 2 | (3) | (5) | - | |
| Total | 142 | 168 | +26 | +18.5% | |
[Summary of Results]
Japan:
Increased income and profits through increased sales of oils and fats, confectionery and bakery ingredients and soy protein.
Asia:
Increased profits through greater profits from oils and fats and confectionery and bakery ingredients.
Europe and Americas:
Decreased profits due to factors including increased costs through the accrual of costs related to the stock acquisition of Harald.
Consolidated Cash Flow
(Units: 100m yen)
| Year ending March 2015 | Year ending March 2016 | Comparison to the previous year | |
|---|---|---|---|
| Net income before tax | 133 | 145 | +12 |
| Depreciation expenses | 86 | 99 | +13 |
| Others | (74) | (84) | (9) |
| Operating cash flow | 145 | 160 | +15 |
| Investment cash flow | (140) | (348) | (209) |
| Free cash flow | 5 | (188) | (193) |
| Procurement/repayments through loans, etc. | (6) | 276 | +282 |
| Dividend payments/share buyback, etc. | (27) | (36) | (9) |
| Financial cash flow | (33) | 240 | +273 |
| Increase and decrease in cash and cash equivalents | Including translation differences -> (19) | Including translation differences -> 40 | +58 |
| Increase and decrease due to new consolidations | - | 0 | +0 |
| Cash and cash equivalents at the end of period | 127 | 167 | +40 |
(Note):
Depreciation expenses include depreciation of tangible fixed assets and intangible fixed assets, etc.
• Increase and decrease in cash and cash equivalents include translation differences on cash and cash equivalents.
Consolidated Full Year Forecast by Segment
(Units: 100m yen)
| Year ending March 2016 | Year ending March 2017 | Comparison to the previous year | |||
|---|---|---|---|---|---|
| Difference (amount) | Difference (ratio) | ||||
| Revenue | Oils and Fats | 1,088 | 1,143 | +55 | +5.1% |
| Confectionery and Bakery Ingredients | 1,382 | 1,562 | +180 | +13.0% | |
| Soy Protein | 405 | 395 | (10) | (2.5%) | |
| Total | 2,875 | 3,100 | +225 | +7.8% | |
| Operating profit | Oils and Fats | 64 | 56 | (8) | (12.5%) |
| Confectionery and Bakery Ingredients | 92 | 106 | +14 | +15.5% | |
| Soy Protein | 13 | 13 | +0 | +2.8% | |
| Total | 168 | 175 | +7 | +3.9% | |
| Operating profit ratio | 5.9% | 5.6% | (0.3p) | - | |
| Ordinary profit | 141 | 160 | +19 | +13.3% | |
| Net income attributable to shareholders of parent company | 92 | 100 | +8 | +8.4% | |
Consolidated Full Year Forecast by Area
(Units: 100m yen)
| Year ending March 2016 | Year ending March 2017 | Comparison to the previous year | |||
|---|---|---|---|---|---|
| Difference (amount) | Difference (ratio) | ||||
| Revenue | Japan | 1,800 | 1,818 | +18 | +1.0% |
| Asia | 530 | 599 | +69 | +13.0% | |
| Europe and Americas | 546 | 683 | +137 | +25.2% | |
| Total | 2,875 | 3,100 | +225 | +7.8% | |
| Operating profit | Japan | 120 | 105 | (15) | (12.6%) |
| Asia | 42 | 45 | +3 | +6.5% | |
| Europe and Americas | 9 | 27 | +18 | +199.1% | |
| Elimination | (3) | (2) | +1 | - | |
| Total | 168 | 175 | +7 | +3.9% | |